
The Price of Patient Capital, 1950–2023
Evidence essay · Experimental badge · Working paper, rev. 4e, October 2026
The Bank exists to lead cross-border finance toward patient capital and away from hot money, and to supplement private capital where it is not available on reasonable terms. FAND’s balance sheets for most members since 1950 say it has worked — at a snail’s pace and unevenly. The question for the Bank is pace, not course.
Two indicators carry this. Net Worth is the bottom line of the balance sheet the Bank’s 1995 Monitoring Environmental Progress (MEP) left on page 65: capitalized Atlas GNI (CommonWealth, CW), split among four types of capital, plus what nonresidents owe residents, less what residents owe them. The Wealth Risk Premium prices the fourth type’s shortfall below a floor as a rate add-on. That fourth type — Social Infrastructure in MEP, Other Substantive Rights (OSR) in FAND — is the largest asset of every income group, and the one no orthodox database recognizes, let alone values. Below the floor, here 20 percent of CW, the shortfall is booked as a liability, Deferred Maintenance of Trust (DM), and priced over a base rate of 1.5 percent. Figure numbers follow the working paper.
The premium since 1950
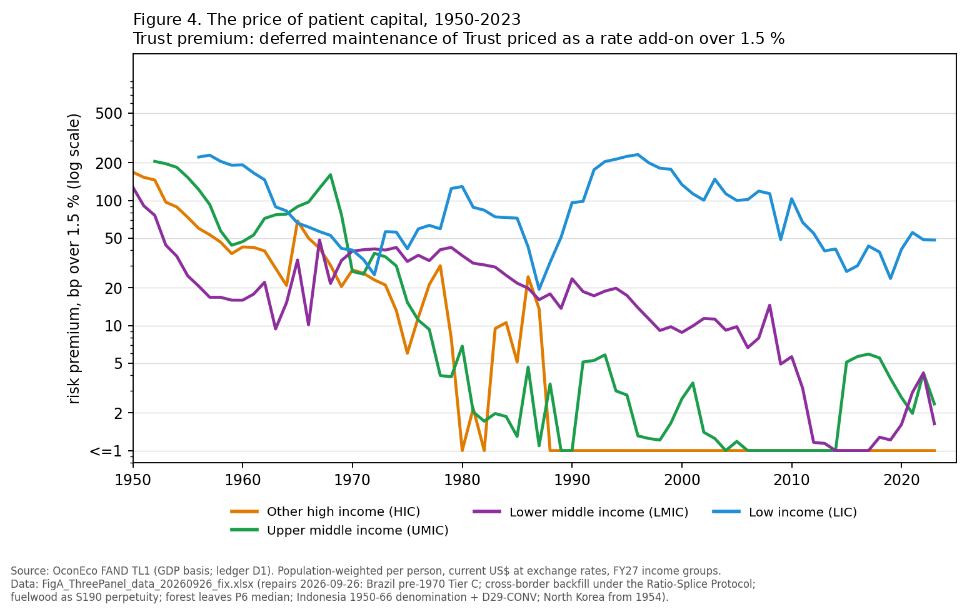
Priced as a premium at the Bank borrower tier, the drag on access fell to nothing in high-income members by 1990 and in both middle-income groups by about 2010. It never left the low-income group: near 50 basis points today after 200 in the 1990s. Since 2015 a small premium has returned to both middle-income groups. Whether from the efforts of the Bank and others or more roundabout causes, progress elsewhere has left the low-income group behind.
What others charge the same people
Cross-border claims on low- and middle-income economies stack in tiers, and every tier claims to take the Bank’s financial preference mechanism into account in its own allocation. At the top is about $10 trillion of inward FDI; below it, $7.6 trillion of other external debt; near the base, $1.4 trillion lent by the Bank and other development banks; all of it resting on some $40 trillion a year of Atlas GNI. The market’s price at the top tier is the equity risk premium and at the debt tier the sovereign default spread, each read here as the excess over high-income economies, where most capital is. The Bank tier should carry markedly less, and that is where FAND’s premium belongs.
| World Bank income group | People (millions) | Inward FDI, about $10 trillion: equity risk premium | Other external debt, about $7.6 trillion: default spread | Bank and other MDBs, $1.4 trillion: FAND premium | Bank rating (1/CPR) |
|---|---|---|---|---|---|
| High income | 1,391 | 0 | 0 | 0 | – |
| Upper middle income | 3,034 | 189 | 105 | 2 | – |
| Lower middle income, no IDA access | 1,694 | 319 | 166 | 1 | – |
| Middle income, IDA access | 1,206 | 695 | 453 | 2 | 0.33 |
| Low income | 612 | 814 | 617 | 48 | 0.36 |
| All low and middle income | 6,546 | 368 | 227 | 6 | – |
World Bank FY27 income groups. Middle income is split by current access to IDA (IDA-only or Blend); 29 million people in upper-middle-income small states with such access are counted in that row. Market premiums are Damodaran's July 2026 estimates, built on Moody's sovereign ratings: the total equity risk premium at the FDI tier and the rating-based default spread at the debt tier, each a population-weighted mean over the people priced, less the same mean for high income. FAND premium is for 2023, a mean over all people in the group, as in Figure 4. The Bank rating is the inverse of the IDA Country Performance Rating for 2023, so that higher means riskier; the Bank rates only IDA-eligible members. Sources: Damodaran, Country Default Spreads and Risk Premiums (NYU Stern, July 2026); UNCTAD, World Investment Report 2024; World Bank, International Debt Statistics, IDA Country Performance Ratings and FY27 classifications; OconEco FAND.
The ladder runs as it should. For all low- and middle-income economies the market asks about 370 basis points more than in high-income economies at the FDI tier and 230 at the debt tier; FAND’s premium at the Bank tier is 6. The rungs are highest where income is lowest: about 810, 620 and 48 for the low-income group. The middle is where the raters part. The market prices middle-income members that still draw on IDA close to the low-income group, at about 700 basis points on FDI against 190 to 320 for the rest of middle income. FAND finds almost none of them on the floor and gives every middle-income row 1 or 2 basis points. The Bank’s own rating leans the market’s way, but faintly.
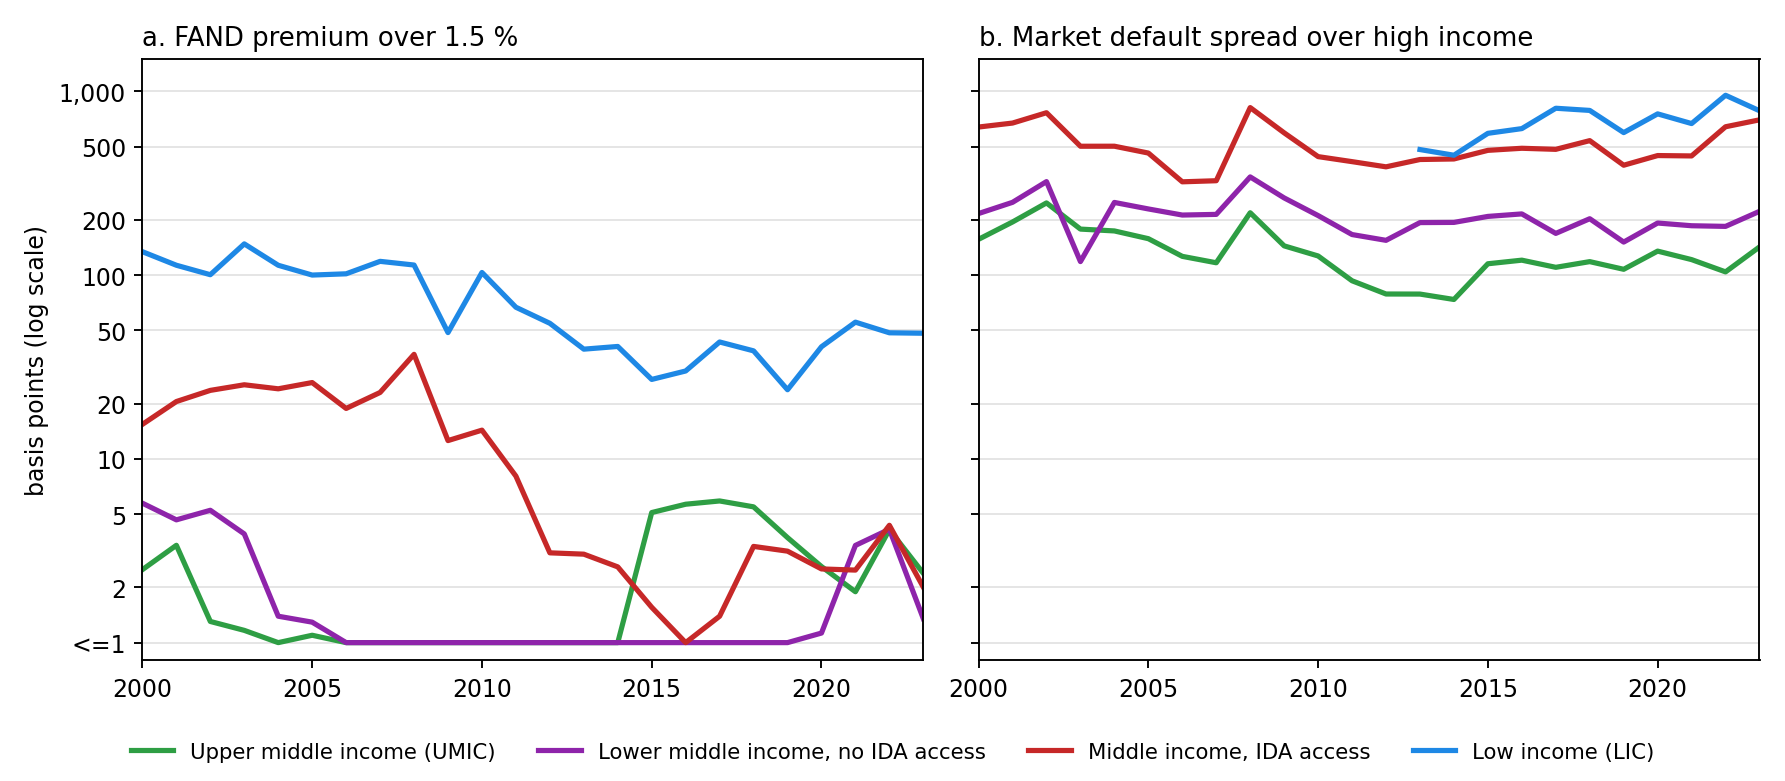
In the low-income group both stay high: FAND’s premium throughout, the market’s for as long as it has priced these members. The recent return of a premium shows in both readings but falls in different places. The market’s has risen most for middle-income members with IDA access, from about 400 basis points in 2019 to 700 in 2023. FAND’s has returned where there is no such access, at 1 to 6 basis points, while its premium for members with IDA access fell from about 25 in the mid-2000s to 2. The market is pricing treasuries under strain; FAND is pricing places where Trust has slipped. A member can have either problem without the other.
A sequence, not a grade. Where OSR is on the floor, money for roads, forests or schools is booked by FAND as deferred maintenance of Trust until it is not. The risk premium says how far off the floor a member is; neither the market’s premium nor the Bank’s rating can. Carrying that premium beside Atlas GNI in the financial preference mechanism is the operational case MEP made in 1995 and FAND makes now.
The balance sheet behind it
| Code | Row | High income (HIC) | Upper middle (UMIC) | Lower middle (LMIC) | Low income (LIC) |
|---|---|---|---|---|---|
| 1.1.1 | Claim-Rights (= PA + NC + CBA) | 335,261 | 60,760 | 12,769 | 5,440 |
| 1.1.1.2 | PA — Produced Assets | 162,174 | 42,996 | 7,420 | 2,134 |
| 1.1.1.3 | NC — Natural Capital | 13,943 | 10,922 | 4,511 | 3,028 |
| 1.1.1.4 | CBA — Cross-Border Claim-Rights | 159,144 | 6,842 | 838 | 277 |
| 1.1.2 | Substantive Rights (= HR + OSR) | 638,469 | 129,784 | 34,658 | 8,423 |
| 1.1.2.1 | HR — Human Resources | 281,782 | 57,939 | 8,779 | 3,561 |
| 1.1.2.2 | OSR — Other Substantive Rights | 356,687 | 71,845 | 25,880 | 4,862 |
| ASSETS (= PA + NC + CBA + HR + OSR) ≡ LIABILITIES (DM + CBL + NW) | 973,731 | 190,544 | 47,427 | 13,862 | |
| 1.2.1.1 | DM — Deferred Maintenance of Trust | 449 | 188 | 30 | 594 |
| 1.2.3 | CBL — Cross-Border Duties | 163,199 | 6,453 | 1,334 | 874 |
| 1.2.4 | NW — Net Worth | 810,083 | 183,904 | 46,064 | 12,395 |
| CW — CommonWealth (capitalized income) | 814,138 | 183,514 | 46,559 | 12,991 | |
| Risk premium over 1.5 % (basis points) | 1 | 1 | 1 | 36 | |
| Population (millions) | 1,421 | 3,093 | 2,946 | 769 |
World Bank FY27 income groups (high income includes the United States). Population-weighted means per resident, current US$ at exchange rates; 2025 gaps completed by assuming non-reporters move with their group. The floor for OSR is 20 % of CW. Cross-border rows are the IMF-published positions wherever one is published; other members move with their group. Source: OconEco FAND.
MEP, and now FAND, capitalizes Atlas GNI. Capitalized versions of the textbook inputs, labor and capital, are then subtracted; capital is split between Produced Assets and Natural Capital because claim-rights to the latter are so incomplete that it is routinely undervalued even when and where scarce. What remains is the fourth type of capital, the logical equivalent of the Solow residual. OSR is the largest single asset on every income group’s balance sheet, 34 to 54 percent of assets, and it is the one whose shortfall impairs the return on the other three. Any floor would show many more borrowers on it in the past than now; those still on it are mostly low-income, whose Deferred Maintenance is 5 percent of CW. That yields a Wealth Risk Premium of 36 basis points against about 1 for the other income groups.
Debt overhang: the second indicator
The second marquee indicator is Net Worth: CommonWealth plus what nonresidents owe a nation’s residents, less what those residents owe nonresidents. In Figure 2 the two differ by little. High-income residents owe nonresidents less than 1 percent of their CommonWealth, net; low-income residents owe nearly 5 percent of theirs. The difference is arithmetically small and effectively large: 5 percent of wealth is most of a year’s income, owed at the highest premiums in Figure 5a. Nor does the ratio mean the same thing everywhere. Residents of the United States owe nonresidents about 4.5 percent of their CommonWealth, much the same share as the low-income group, and pay no premium on it. For them the position is patient capital arriving. For a member on the floor it is overhang, because the premium falls on every dollar rolled over. Figure 6 counts the people on each side.
| World Bank income group | People (millions) | Owing more than 3 % of CommonWealth | Owing 1 to 3 % | On FAND's floor | On the floor and owing more than 3 % |
|---|---|---|---|---|---|
| High income | 1,391 | 440 | 207 | 0 | 0 |
| Upper middle income | 3,063 | 76 | 1,004 | 41 | 3 |
| Lower middle income | 2,871 | 371 | 502 | 46 | 0 |
| Low income | 612 | 427 | 86 | 234 | 212 |
| World | 7,937 | 1,313 | 1,798 | 320 | 216 |
World Bank FY27 income groups (high income includes the United States). Net position is cross-border claim-rights less cross-border duties, as a percent of CommonWealth; members without cross-border data (191 million people) are not counted in the owing columns. On the floor: Other Substantive Rights at 20 percent of CommonWealth, so that FAND books Deferred Maintenance of Trust. Balance sheets for 2023, as in Figures 4 and 5; Figure 2 is for 2025. Source: OconEco FAND.
In the low-income group the two liabilities compound. Of its 612 million people, 427 million live in members that owe nonresidents more than 3 percent of their CommonWealth, and 212 of the 234 million on the floor are among them. Elsewhere they rarely meet: 87 million middle-income people are on the floor, and 3 million of them are in members owing that much. The two can be told apart where capital already has access. Where it does not, they cannot. So the two marquee indicators are read together: Net Worth says how much of a nation’s wealth is owed abroad or due from abroad; the premium says what that position costs to carry. A member has graduated when the premium is gone, whatever the position.
The vase
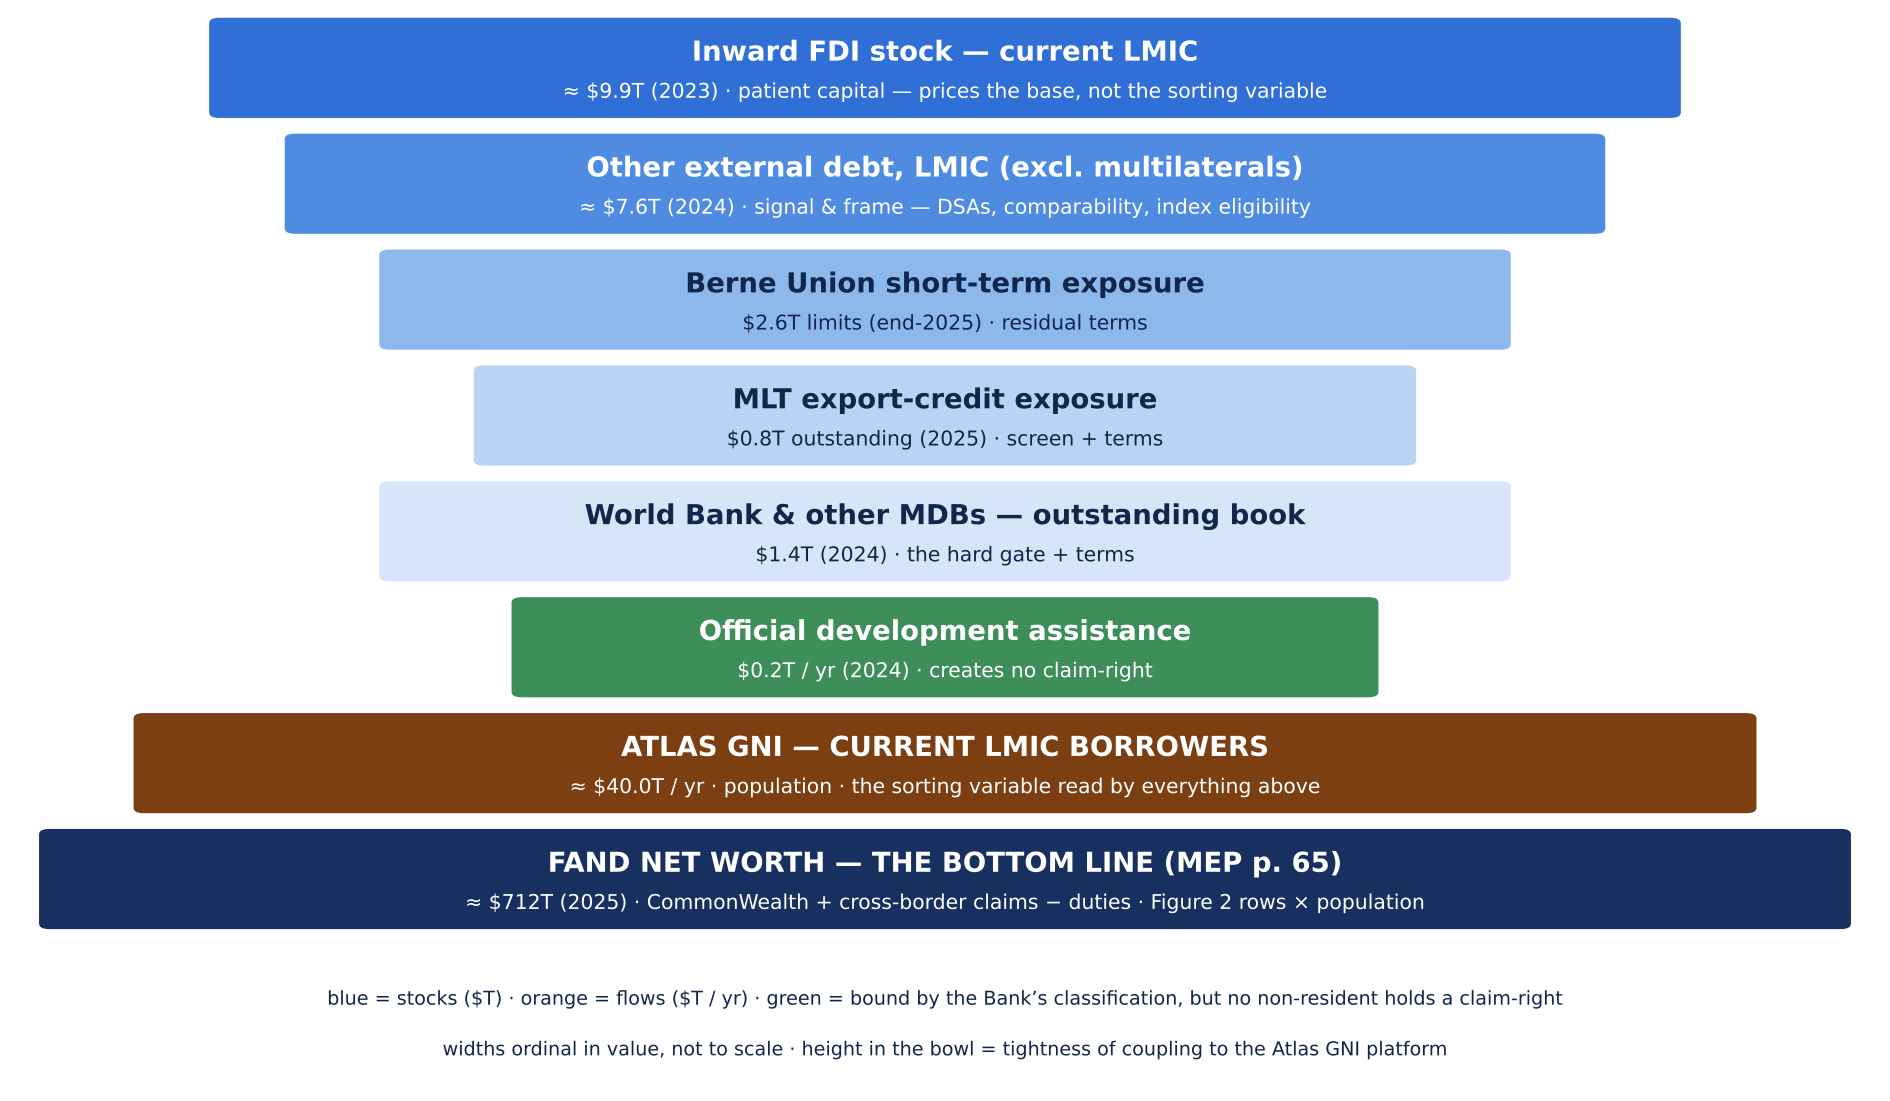
Figure 1 pictures the global vase for members still unable to access private capital at reasonable rates. Low per capita income became a necessary but not sufficient condition for the Bank’s funds; quantifying the base led others to do the same in their decision-making, which helped fill the vase but placed more weight on the Bank’s Atlas GNI metrics. By the time the author became gatekeeper for such data (1985), the top tiers of the vase loomed large over that thinly described base. So he sought to thicken the base with national balance sheets — which MEP proposed a decade later and FAND now provides. Such cross-border liabilities equal half of Atlas GNI but barely 3 percent of capitalized GNI.
Wealth as a policy signal: FAND versus CWoN
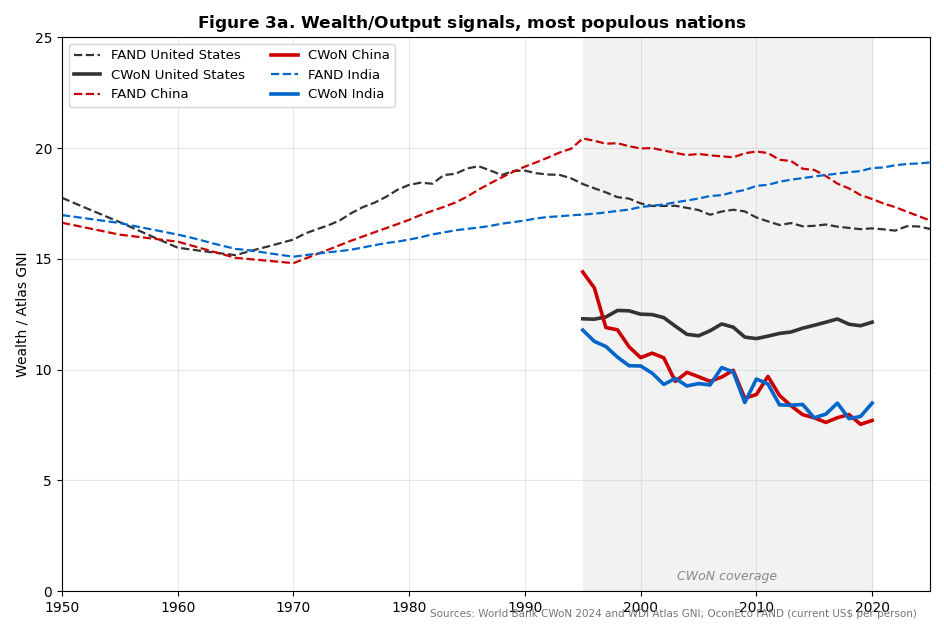
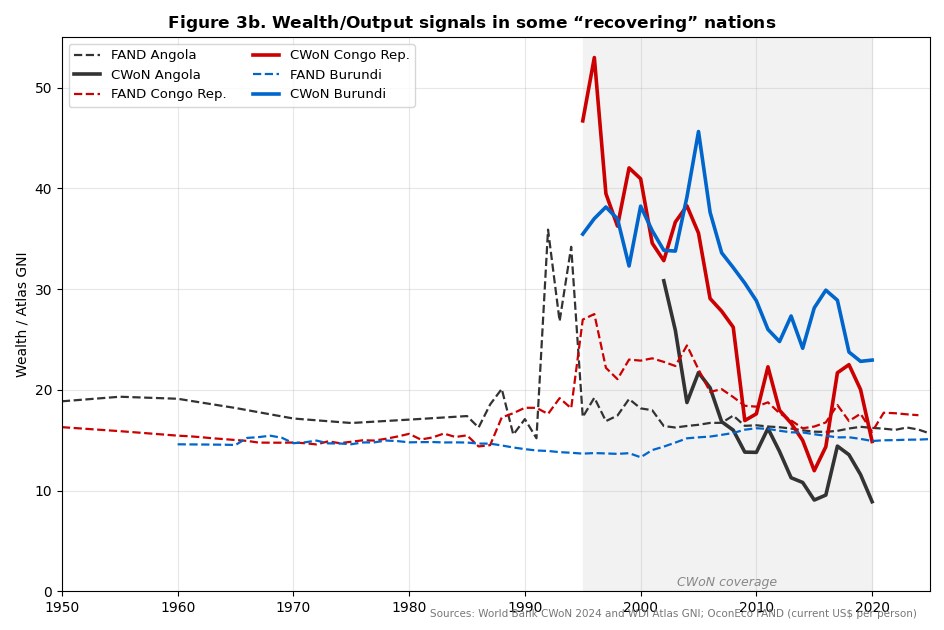
Since theory has patient capital attracted by its most productive use, it must gravitate toward places where the capital/output ratio is lowest, other things being equal. They rarely are, but an indicator is to point; and FAND and CWoN point patient capital in different global directions. CWoN has China and India becoming remarkably more productive than the US, and Burundi, Angola and the Republic of Congo racing from ratios of 35 to 50 in the 1990s to between 9 and 23 by 2020 — so signaling less need for financial preferences. FAND has the first two on quite different trajectories, and the last three flat. Less need for financial preferences is not what those trajectories say. The comparative analysis sets out the accounting differences behind the two signals.
The working paper
The figures above are from FAND’s Marquee, a working paper (rev. 4e, October 2026) that sets out the two indicators, the Fundist case for capitalizing income rather than summing objects, the floor and its calibration, and the work in progress: cross-border positions carried back from 1990 to 1950, the premium on a moving base rate, Damodaran’s equity premiums year by year, every CPIA criterion set beside the balance sheets, and a first event study of members leaving the floor. The results are rough and systematized, and the paper says so. Download the working paper (PDF).
Source: OconEco FAND TL1 (GDP basis; ledger D1), population-weighted per person, current US$ at exchange rates, FY27 income groups. Figure 4 data: FigA_ThreePanel_data_20260926_fix.xlsx. Figures 5a, 5b: Damodaran (NYU Stern) default spreads 2001–2026 and July 2026 equity risk premiums; IDA CPR 2006–2023. Experimental badge: the balance sheets behind these figures are a prototype; metadata (NUSAP) travels with each series in the replication package.
Related reading
- For patient capital — the pathway this page belongs to.
- United States — full ledger — the anchor exhibit, and the reserve-currency exception to the overhang reading.
- Take-Off in Convergence Terms — the non-convergence record the premium is read against.
- FAND vs CWoN — why the two balance sheets point patient capital in different directions.
- How we grade what we publish — the badge system this page’s Experimental rating comes from.