
Main Street Millionaires
The Main Street Millionaires deck and video: a county income statement by industry, and three flows across the county line.
Experimental
Main Street Millionaires video
A ten-minute narrated walkthrough of the Main Street Millionaires deck (13 slides, 17 October 2026 revision): who holds the wealth, where the businesses earn it, and where the owners live.
Experimental. For every CEO of a large public company there are more than a thousand owners of closely held businesses averaging about twenty-five million — the Main Street Millionaires, holding far more than the Forbes 400 between them (Owen Zidar and Eric Zwick, The Everywhere Millionaire, 2025). They built that wealth in pass-through businesses, county by county. Nothing in the national accounts shows it at that scale: GDP is booked where a corporation reports, not where the plant and payroll are, and pass-through income is published nationally by industry, never by county. The two tables below are a first county income statement built to close that gap — provisional, and labeled as such.
One national pattern, two local ones
Zidar and Zwick show, from national data, that pass-through income depends on what they call local moats — licenses, franchise territories, relationships — and that the moats vary by industry and by place. Confidentiality keeps them from showing it where the rubber meets the road: in counties. Their data are published only as national totals by industry, and no county source observes pass-through income directly.
FAND distills a county indicator from public data, county by county: one detailing of the national industry lines, then two cuts of it. The estimates are imprecise, but they say two things an advisor needs. Which moats are where — and why patient capital has to look at two places, where a business earns its income and where its owners live. BEA publishes masses of county data that do neither. FAND does both, crudely.
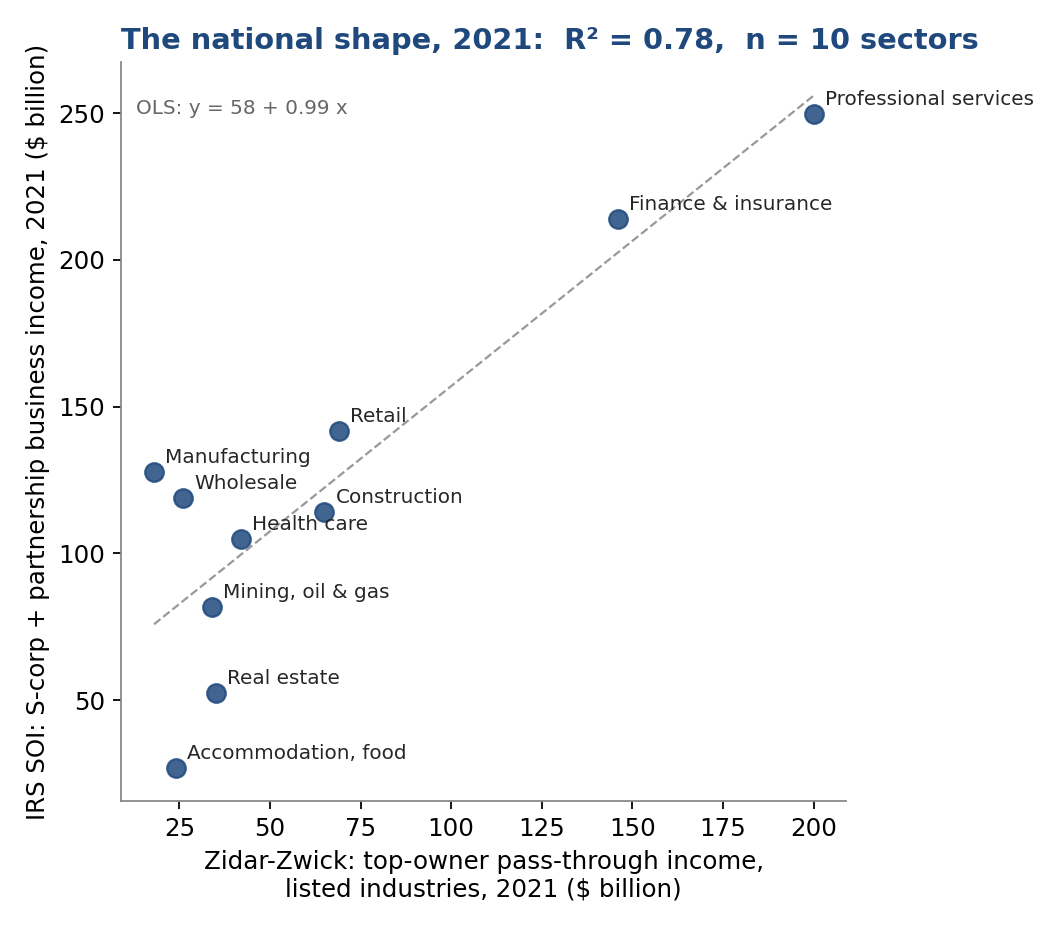
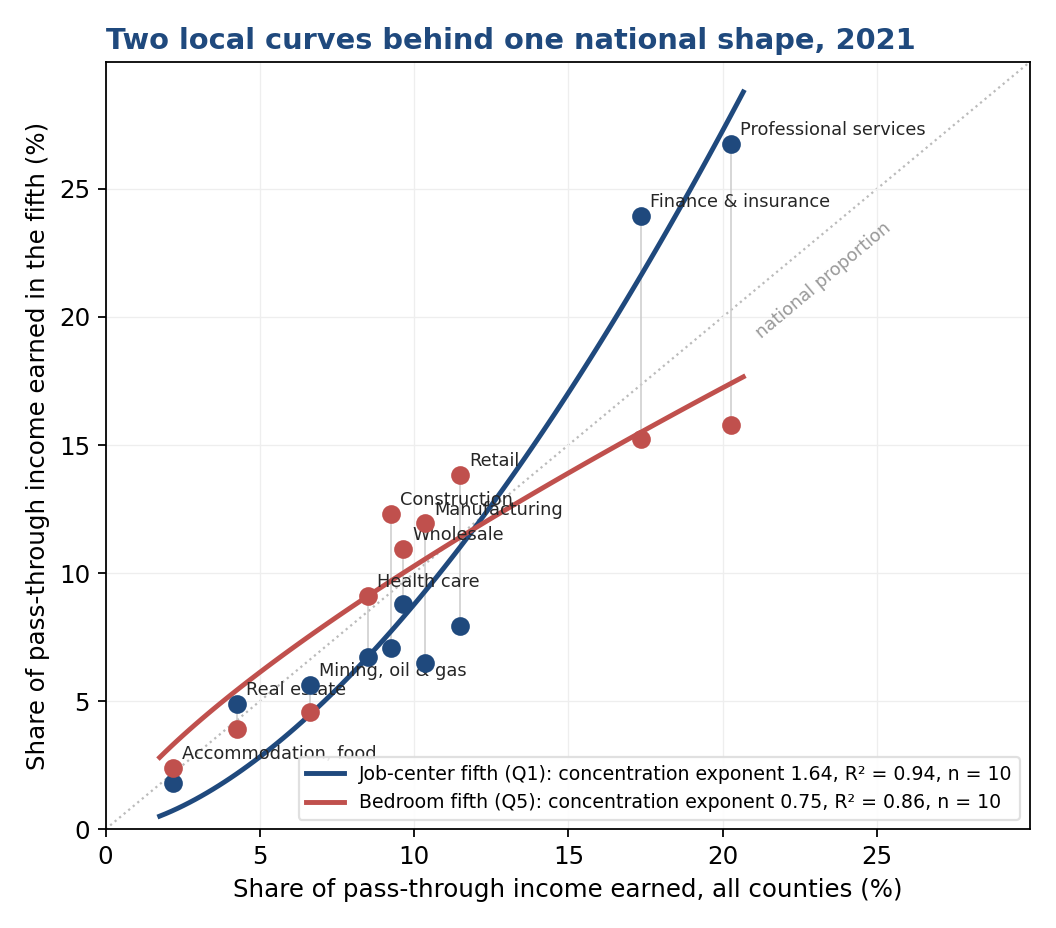
In the job-center fifth, finance and professional services are half of all pass-through income (51%, against 38% nationally), and retail, manufacturing and construction are under-weight. The bedroom fifth is the mirror: construction a third above its national share, retail and manufacturing a fifth above, professional services a fifth below — finance and professional services together just 31%. The middle three fifths look like the bedroom counties. The national shape is the job centers’ shape because that is where the dollars are ($385 billion of $1.2 trillion), but four Americans in five live where Main Street income is spread across the trades. Fine industry detail at the national level can’t tell an advisor what is in their county.
What FAND adds for the local advisor
Capital can be measured in two places: where it is used — the plant, the payroll, the place — and where its owner lives. Public data do this for labor and not for capital.
| By place — where it is used | By owner — where its owner lives | |
|---|---|---|
| Labor | Public: BEA earnings by place of work. | Public: BEA's residence adjustment moves commuters' earnings home. |
| Capital | Public: none. BEA books profits where the company reports them, often at headquarters. FAND: Gross Territorial Product and the county balance sheet, held and used. | Public: none. The IRS reports some of the income (pass-through, dividends) where filers live; no one capitalizes it. FAND: pass-through owners by county of residence; corporate owners next. |
FAND’s estimates of each are crude, but the gap between them is the point. That gives the local advisor three products:
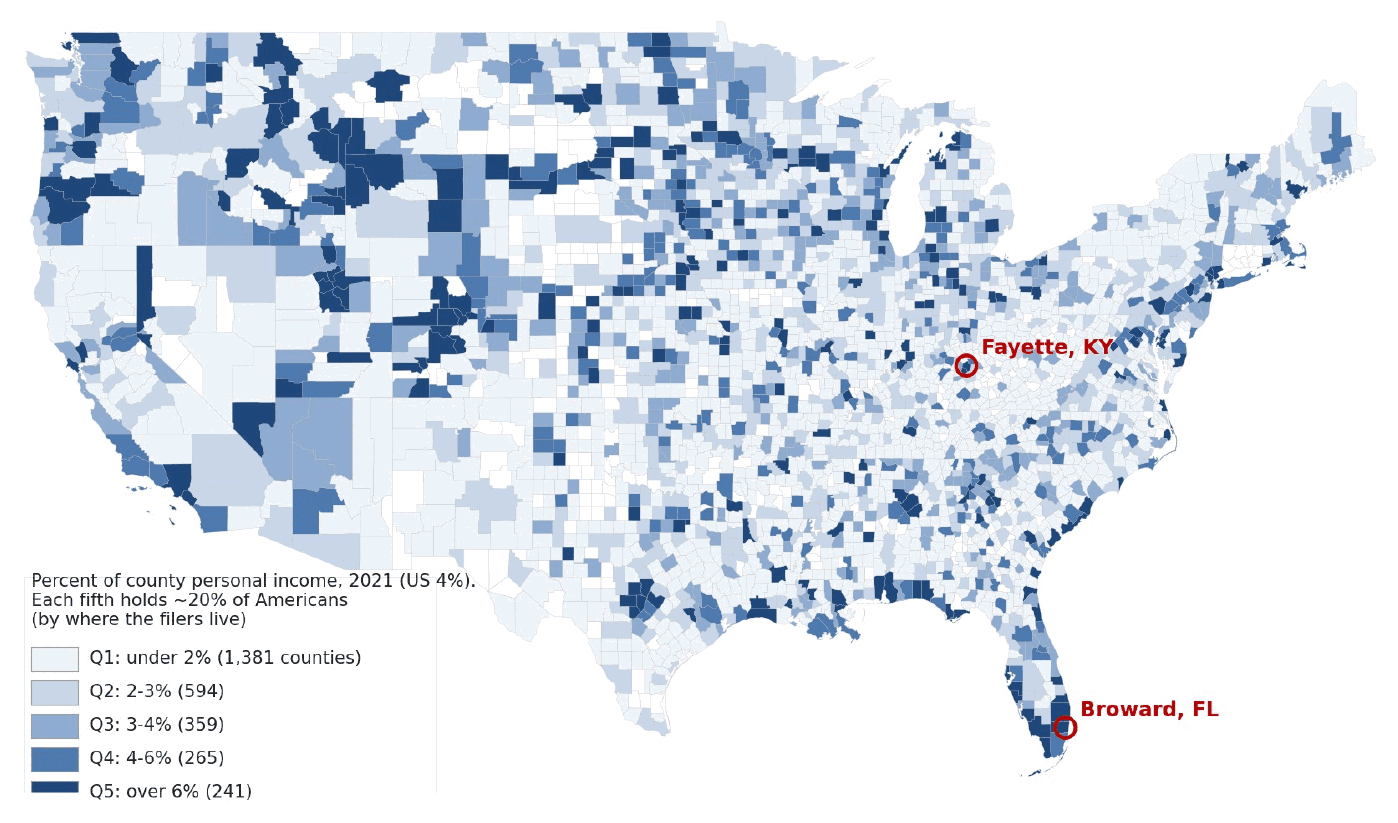
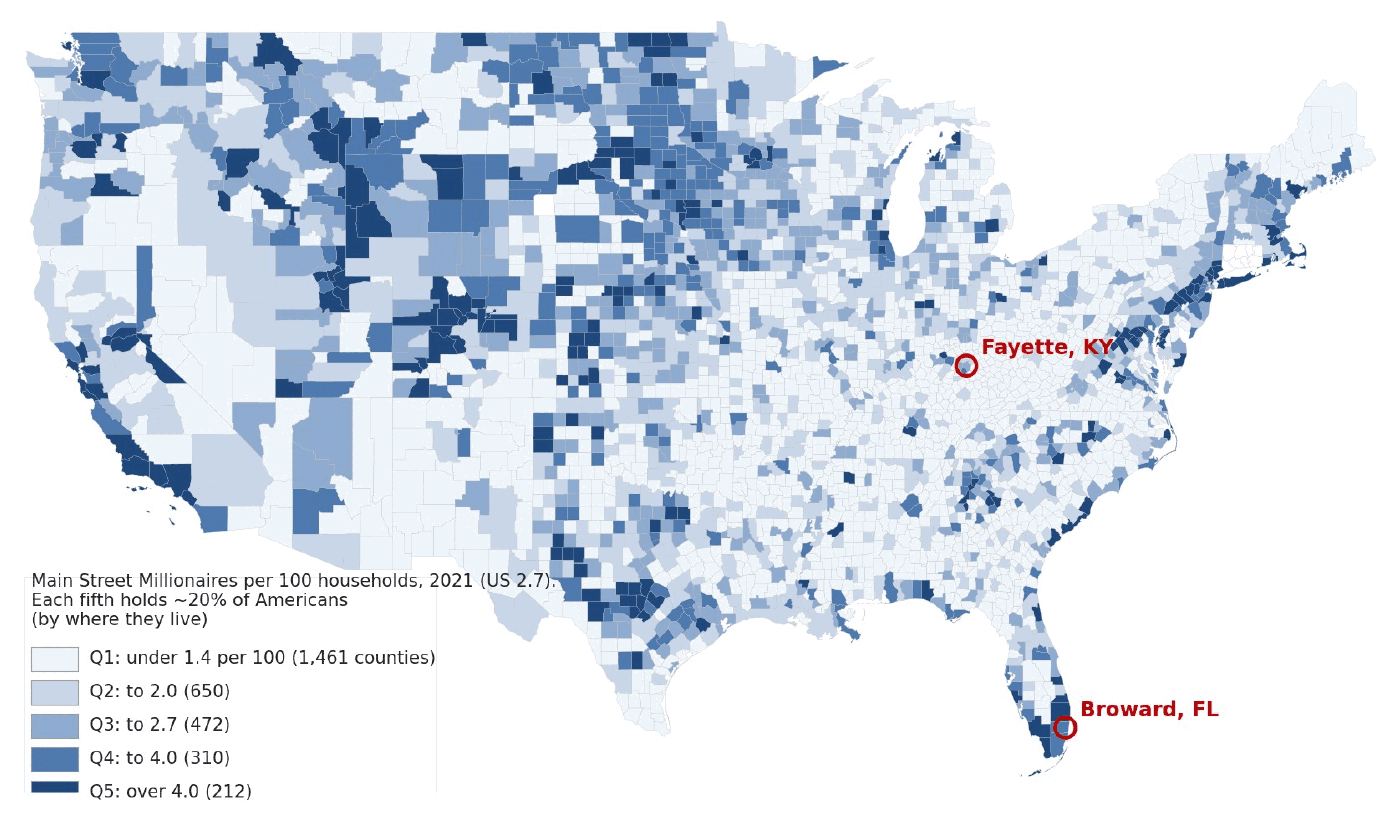
- Capital by owner. Where Main Street Millionaires live: their pass-through income by county of residence, from public IRS and Census data, and how many of them there are. (The two maps below.)
- Capital by place. A balance sheet and an income statement for every county, per resident: what its payroll and plant hold and use, whoever owns them. (Broward and Fayette below; the same page exists for 3,000+ counties.)
- The gap between them. Corporate surplus is booked far from where it is earned; Main Street owners live near what they own. What leaves with the owner is the succession question. (The three flows and the Tuesday-morning table below.)
The same gap exists between nations, where it is called base erosion and profit shifting (BEPS). The U.S. is beginning to comply with the OECD process to curtail it, with tax consequences from the establishment level up — something most institutional investors know and few Main Street owners do. FAND assembles a rudimentary direction-of-capital matrix from counties up to nations’ international investment positions. Local knowledge, with the numbers to back it: FAND is for the thousand, not the CEO.
Capital by owner: where their income lands, and how many
The IRS reports, county by county, the partnership and S-corporation income on the returns of people with $200,000 or more of income — counted where they live, wherever the business is.
People, not dollars, make the decisions. The same IRS data count the returns: 3.4 million — about one American in a hundred, or 2.7 for every hundred households.
Capital by place: a county balance sheet, held and used
Main Street owners invest where they live, so the place needs books of its own. An investor assessing a business expects a balance sheet; FAND gives one to every county. This is capital by establishment — what the county holds and uses, whoever owns it. Claim-rights are what a legal system recognizes and values: produced assets, natural capital, cross-border claims. Substantive rights are the rest of what makes a place productive: its people, and what FAND calls Social Infrastructure — how people collaborate while competing. That is where moats are built and modified, by local custom as well as by law, and it varies markedly between U.S. counties.
| Broward, FL | Fayette, KY | |
|---|---|---|
| Assets | ||
| Claim-rights | 329,530 | 323,807 |
| Produced assets | 226,729 | 219,855 |
| Natural capital | 76 | 1,227 |
| Cross-border claim-rights | 102,725 | 102,725 |
| Substantive rights | 849,564 | 1,198,004 |
| Human resources | 384,276 | 479,168 |
| Other substantive rights (Social Infrastructure) | 464,784 | 718,836 |
| Subnational substantive right (residents' net earnings from jobs elsewhere, capitalized) | 504 | 0 |
| Total assets = total liabilities | 1,179,094 | 1,521,811 |
| Liabilities | ||
| Intragenerational | 0 | 84,664 |
| Subnational substantive duty (commuters' net earnings here, capitalized) | 0 | 84,664 |
| Intergenerational (unfunded Social Security, financial overhang) | 62,756 | 62,756 |
| Cross-border duties | 158,088 | 158,088 |
| Net worth | 958,250 | 1,216,303 |
| Memo | ||
| Commonwealth, held and used | 1,075,865 | 1,419,086 |
| GDP per resident (BEA) | 68,574 | 71,099 |
Both counties run 2021–2025 in the full page; years a source hasn’t reported yet are carried forward with the U.S. GDP deflator and marked as such. Cross-border claims and duties and the intergenerational line are national figures apportioned by population — placeholders until owner-based legs are built — which is why they match across the two counties. Fayette carries a liability Broward doesn’t: it is a job center, and the earnings of commuters who work there and live elsewhere are capitalized as a duty.
Capital by place: the county income statement — Broward County, FL, 2021
BEA books value added where the corporation reports it. FAND’s Gross Territorial Product (GTP) books it by establishment — where payroll and plant are — and splits it four ways: employees’ compensation, employers’ capital income, and the row a conventional income statement never shows, the owner’s own labor versus the owner’s return on capital.
| Industry | BEA GDP where booked | FAND GTP by establishment | Employees' compensation | Employers' capital income | Owners' labor (modeled) | Owners' capital (modeled) | BEA less FAND | memo: Main Street pass-through income |
|---|---|---|---|---|---|---|---|---|
| Agriculture, mining, utilities | 382 | 396 | 98 | 286 | 9 | 3 | (14) | 7 |
| Construction | 2,922 | 2,889 | 2,324 | 113 | 281 | 171 | 33 | 545 |
| Manufacturing | 2,067 | 2,527 | 1,348 | 1,012 | 115 | 52 | (460) | 150 |
| Wholesale trade | 7,193 | 6,206 | 2,951 | 3,032 | 104 | 118 | 986 | 494 |
| Retail trade | 6,249 | 5,983 | 3,627 | 2,097 | 168 | 90 | 266 | 611 |
| Transportation and warehousing | 2,558 | 2,190 | 1,845 | 141 | 117 | 86 | 369 | 264 |
| Information | 3,906 | 3,698 | 1,580 | 2,048 | 48 | 22 | 208 | 103 |
| Finance and insurance | 4,170 | 4,985 | 2,924 | 1,854 | 122 | 85 | (815) | 688 |
| Real estate (incl. owner-occupied dwellings) | 12,944 | 10,916 | 1,002 | 9,779 | 84 | 50 | 2,028 | 418 |
| Professional, management, administrative | 10,006 | 9,682 | 7,963 | 575 | 735 | 409 | 324 | 1,745 |
| Arts, accommodation, food, other services | 4,787 | 4,819 | 2,799 | 1,155 | 458 | 407 | (32) | 549 |
| Education, health care, government † | 11,412 | 13,522 | 7,437 | 5,565 | 305 | 214 | (2,110) | 596 |
| Total | 68,597 | 67,814 | 35,899 | 27,658 | 2,547 | 1,710 | 783 | 6,170 |
Of about $67,800 per resident of value added where payroll and plant are, about $4,260 is pass-through income inside GDP (owners’ labor plus owners’ capital), most of it in professional, management and administrative services and in arts, accommodation, food and other services. Counting the S-corporation income GDP books elsewhere, Main Street pass-through income is about $6,170 per resident. BEA books more than local substance in real estate and wholesale trade, and less in finance and insurance and manufacturing. The owner columns are modeled. † A known coverage gap in the sources, not a finding: BEA’s government line bundles public education, hospitals and enterprises, which FAND places in their own industries (the System of National Accounts treatment), so this group nets the difference.
The gap: corporate surplus migrates; pass-through income stays local
A county ledger only tells you something a national one can’t once you can see where income is earned against where it’s booked or owned. Four counties, the five population quintiles and the United States, per resident:
| Pike, PA | Pike, KY | Broward, FL | Fayette, KY | Q1 smallest | Q2 | Q3 | Q4 | Q5 largest | United States | |
|---|---|---|---|---|---|---|---|---|---|---|
| USD per resident | ||||||||||
| A. Corporate surplus booked here beyond what local payroll and plant earn (BEA NOS less FAND GTP NOS) | 4,132 | −1,974 | 10,943 | 4,319 | 6,416 | 6,857 | 8,970 | 13,085 | 14,697 | 10,021 |
| of which finance and insurance | 418 | −399 | −277 | −86 | 131 | 375 | 435 | 1,501 | 1,936 | 880 |
| B. Wages: net inflow to residents from jobs elsewhere (BEA residence adjustment) | 19,394 | −2,366 | 55 | −9,180 | 4,072 | 3,687 | 1,149 | −2,151 | −6,640 | −3 |
| C. Pass-through income by establishment (earned here), all filers | 2,060 | 5,341 | 6,168 | 5,572 | 3,905 | 4,515 | 5,557 | 7,157 | 6,337 | 5,495 |
| of which owners with AGI $200,000+ | 1,313 | 5,041 | 4,381 | 4,710 | 2,958 | 3,723 | 4,746 | 6,313 | 5,372 | 4,624 |
| C′. Pass-through income by owner less by establishment (FAND residence adjustment; + = owners live here, businesses elsewhere) | 333 | −2,820 | 2,258 | 644 | −305 | 69 | 380 | 135 | −272 | 0 |
| Relative to the United States (US = 1) | ||||||||||
| A. Corporate surplus booked beyond local substance | 0.41 | −0.20 | 1.09 | 0.43 | 0.64 | 0.68 | 0.90 | 1.31 | 1.47 | 1.00 |
| Memo | ||||||||||
| Population, thousands | 58 | 59 | 1,935 | 321 | 65,114 | 65,213 | 64,580 | 64,452 | 66,584 | 325,944 |
Corporate surplus migrates. BEA books it at headquarters; FAND places it by establishment — the substance test that BEPS and the OECD’s global minimum tax (GLoBE) will apply in private. New York County books $215 billion beyond what its own payroll and plant earn, half of it finance; Pike, KY is below zero, its mining surplus booked elsewhere.
Pass-through income stays close to home. Across the five population quintiles, the net flow to residents (C′) is a few hundred dollars per resident against about $5,500 earned (C): Main Street owners live near what they own. Coal partnerships make Pike, KY the exception — its residents own almost $3,000 per resident less than the county earns. Wages, which BEA gauges both ways, are there for scale: Pike, PA, a bedroom county for New York, brings $19,000 per resident home.
Quintiles order U.S. counties by 2021 population into five groups each holding about a fifth of Americans (Q1 smallest counties, Q5 largest). C′ sums to zero nationally by construction, as BEA’s wage adjustment does.
A Tuesday morning: Fayette, KY and Broward, FL
One client — the owner of a distributor, a dealership, a practice — and three numbers from the county ledger an advisor can put beside what the client already knows.
| Fayette, KY | Broward, FL | |
|---|---|---|
| 1. The place has a balance sheet | ||
| GDP per resident | 71,099 | 68,574 |
| Commonwealth, held and used | 1,419,086 | 1,075,865 |
| of which Social Infrastructure | 718,836 | 464,784 |
| Net worth | 1,216,303 | 958,250 |
| 2. The Main Street share | ||
| Pass-through income inside local value added (owners' labor + capital) | 4,628 | 4,257 |
| Main Street pass-through income, incl. S-corporations | 5,556 | 6,171 |
| 3. Across the county line | ||
| Corporate surplus booked beyond local substance (US = 1) | 0.43 | 1.09 |
| Wages: net inflow to residents (+ bedroom, − job center) | −9,180 | 55 |
| Pass-through income: net inflow to residents (FAND residence adjustment) | 644 | 2,258 |
| The question: what leaves with the owner? | ||
| $200,000+ owners' income: floor (hours at employee rates) / ceiling (all that leaves) | 2,895 / 3,479 | 2,696 / 3,252 |
| Owner-contingent band (ceiling less floor) | 584 | 556 |
Fayette is a job center for wages and a home for owners: its residents own about $640 per resident more pass-through income than the county earns. Broward books more corporate surplus than its payroll and plant earn, and its residents own about $2,260 per resident more than it earns. The band is the county-wide prior for the succession question — what is the business worth without you? — not a valuation of any business. The answer is local knowledge the ledger cannot observe.
What we’d ask an advisor
Three questions only you can answer:
- Relevance. Does FAND show you something about your county and your clients that you would otherwise miss? The one thing it told you that you didn’t know — and the one thing it gets wrong about your market.
- Trust. Can you understand, challenge and validate its estimates? Where you disagree, you are the better source, and the number’s record will say so.
- Commercial value. Would it improve your productivity, client service or business development enough to pay for? Not how much — what for: which of the three products (capital by owner, capital by place, the gap between them), in what form, how often, and what it would replace.
Related reading
- For wealth advisors — the pathway this page is the exhibit for.
- Duval County, FL — county annex — a public sample of the full county balance sheet, row by row, with the honesty badge on every figure.
- The OconEco toolkit — FAND as the entry portal, with the other tools beside it.
- US counties — commuter flows dominate — why GDP misreads a county at all, and how wages cross the line differently from corporate surplus.
- Methodology — guidelines, NUSAP data quality, sources and replication; NUSAP explains the Experimental badge on this page.
What’s here at launch
- The narrated video of the deck (17 October 2026 revision)
- One national pattern and two local ones: the national shape and the job-center and bedroom curves
- Capital by owner: the two maps of where Main Street income lands and how many owners there are
- Capital by place: the 2021 balance sheet for Broward and Fayette, and Broward’s income statement by industry
- The gap: three flows across the county line for four counties, the population quintiles and the US, and the Tuesday-morning comparison
- Honesty badge: Experimental — these are provisional county figures, not for client-facing citation without the caveats above